Understanding the CV tool results.
The CVT measures seven motivators as follows:
Professional Fit |
How well does the role fit the person’s professional skills |
Personal Fit |
How well does the role fit their personal requirements and life to achieve their desired balance |
Cultural Fit |
How well do the values of the organisation fit with their own |
Training |
The importance of receiving training in their work environment |
Mentorship |
The importance of receiving mentorship |
Feedback |
The importance of receiving recognition and feedback |
Financial |
How well the financial reward meets their needs |
How does the scoring work?
An individual allocates a score for each of the motivators - firstly how important that motivator is to them and, secondly, how well the current work environment is meets this. A total of 100 points needs to be allocated between the seven motivators.
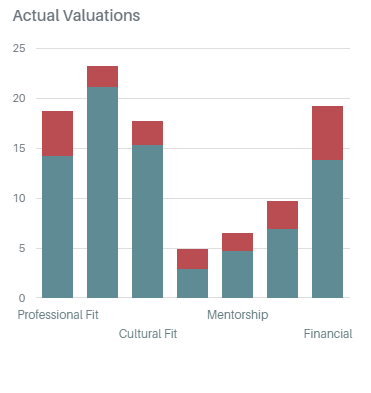
Interpreting the Actual Valuations Bar Chart
Once the scoring has taken place, a bar graph is produced, translating the responses into percentage scores. The horizontal axis of the chart shows each of the motivators with the % score along the vertical axis.
The amount of red indicates the size of the gap between their ideal and their actual scores. You can see at a glance the difference and make an assessment about how you might go about closing the gap if possible.
When viewing the results of the organisation or for a particular team, the bar chart will represent the average scores as a collective.
The average Valuation
The average valuation displays the overall motivation level of the team as a whole. The score is the total of the team’s scores on each of the seven motivators.
Ideal Valuations Chart
This pie chart displays the team’s average score for each of the ideal motivators being measured. The total must add up to 100%.

The Scoring

Classification |
Scoring |
Very Happy |
Above 75% |
Happy |
Between 60%-75% |
Unhappy |
Between 50%-60% |
Very Unhappy |
Under 50% |
The Valuation Distribution
This shows the distribution of each of the team member’s scores plotted on a single chart. Each dot represents a team member. The closer someone is to the centre of the chart, the happier they scored themselves at that time.

 Career Valuation Tool (CVT)